Viewing aggregate questionnaire data in Embodia
Introduction
Embodia's questionnaire analytics feature gives you a bird's-eye view of how your patients are engaging with and responding to your questionnaires — across all patients, not just one at a time. This is useful for identifying response patterns, tracking completion rates, and reviewing how patients answer individual questions at a population level.
If you want to review questionnaire results for a specific patient rather than across your whole caseload, you can find these under the individual patient's profile.
What you need to know before you start
Analytics are only available for questionnaires that meet two conditions:
- The questionnaire has scoring attached to it
- The questionnaire has been completed at least once
If either condition is not met, the Analytics section will not appear.
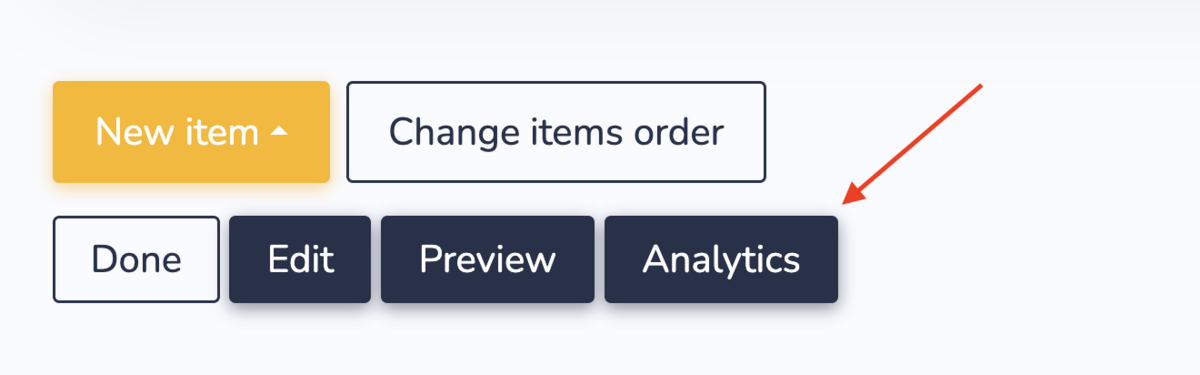
How to access questionnaire analytics
- Go to HEP in the main navigation and select Questionnaires
- Click on the questionnaire you want to review
- Scroll to the bottom of the questionnaire page and click Analytics
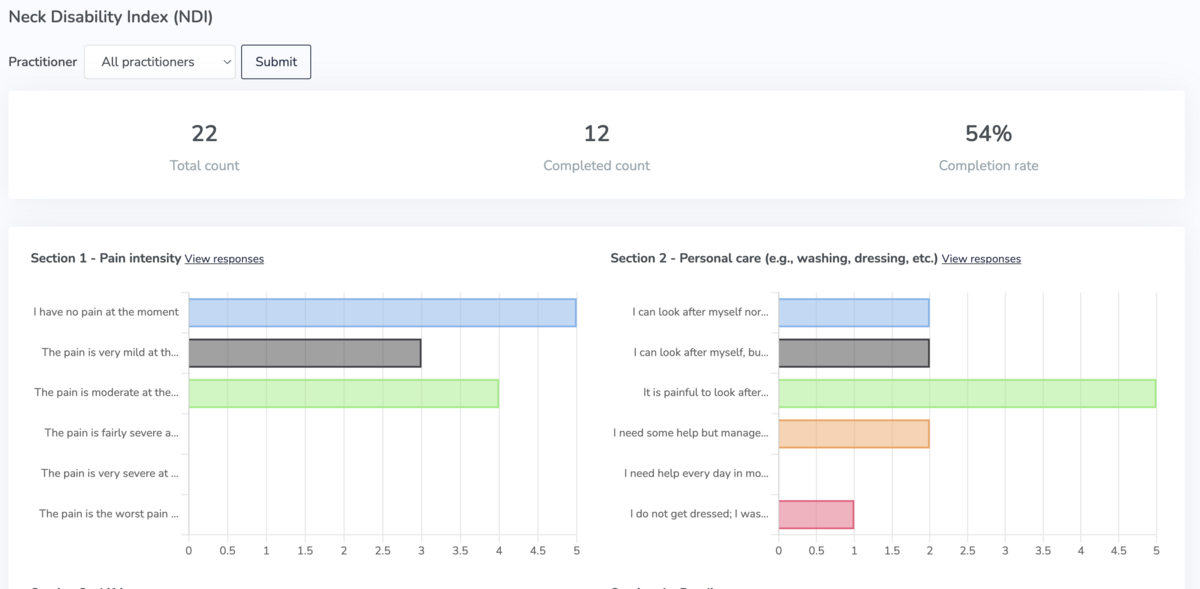
What the analytics page shows
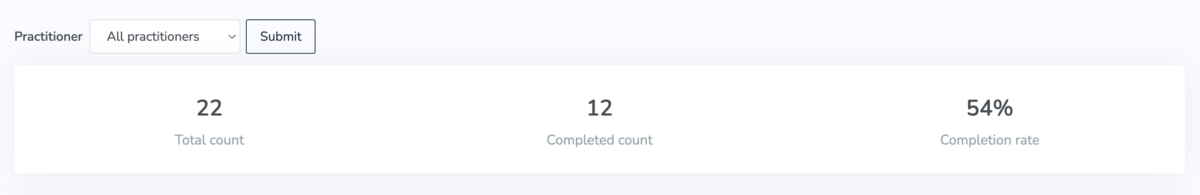
Summary metrics
At the top of the Analytics page, you'll see three summary figures:
- Total count — the total number of times this questionnaire has been shared with patients
- Completed count — the number of times it has been fully completed
- Completion rate — the percentage of shares that resulted in a completed questionnaire
Question-level response data
Below the summary metrics, each question in the questionnaire is listed individually. For each question, you can see the possible responses and the number of patients who selected each one. This gives you aggregate questionnaire data across your entire patient population for that form.
Viewing individual responses per question
Next to each question, click View responses to see a detailed breakdown. This will display a list of every patient who answered that question, the date they responded, and the answer they gave.
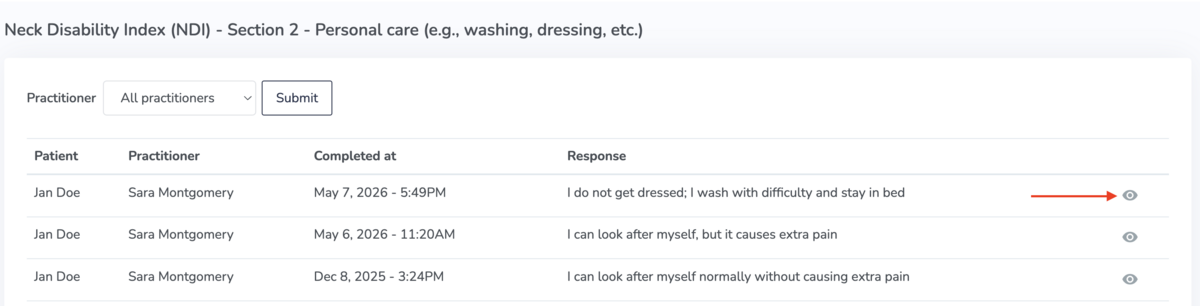
From this list, click the 'eye' icon next to any patient to go directly to that patient's questionnaire page. Here you can review their individual responses and a chart showing their scores over time.
Filtering by practitioner
If you are a clinic manager with multiple practitioners in your clinic, you can filter the analytics by individual practitioner — both on the summary view and within the per-question response list. This allows you to review questionnaire data for a specific clinician rather than across the clinic as a whole.